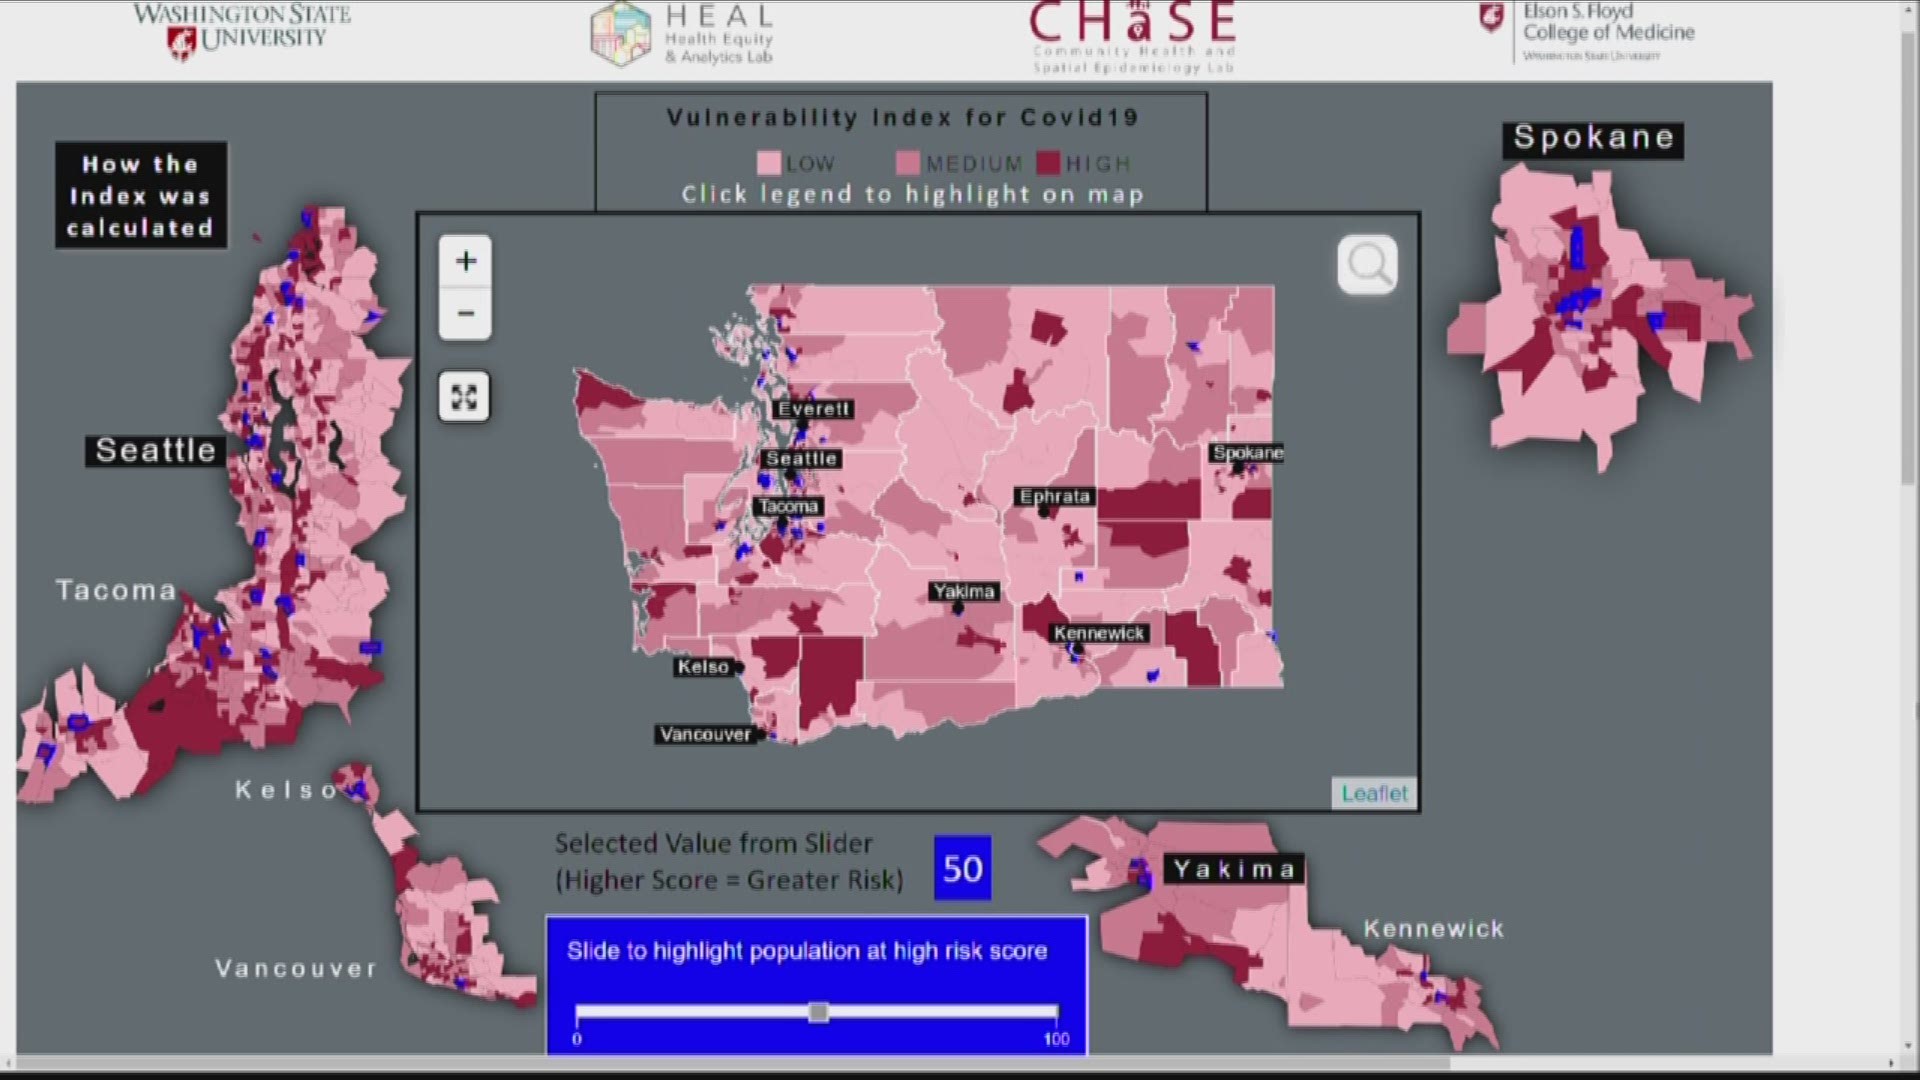
SPOKANE, Wash. — Washington State University has created a new, interactive map to show which areas of the state are more at risk from COVID-19.
It was created by the Community Health and Spatial Epidemiology (CHASE) lab, which is part of WSU's Elson S. Floyd College of Medicine.
The darker red colors on the map represent which communities are more vulnerable, and where people are more likely to develop serious complications from the coronavirus.
Researchers used five years of data from the U.S. Census Bureau and the Washington State Department of Health.
The map highlights pockets of people over the age of 65 or those with underlying health conditions like heart disease, chronic lung conditions and diabetes.
It also shows areas of higher population, where the coronavirus is more likely to spread.
But it's important to understand the map is not meant to show where the virus is more prevalent, but rather where people are who are considered more 'high risk.'
Dr. Pablo Monsivais, Assistant Professor at WSU's Department of Nutrition and Exercise Physiology, said he doesn’t want people to look at the map and become alarmed.
"It was really meant for public health leaders and local policy makers," Monsivais said.
He said with limited resources, like test kits and PPE, the map can help local leaders determine where supplies could best be utilized.

